Dubai Real Estate Market Report Q1 2026: Record AED 108B, 20,500+ Monthly Transactions

Dubai Real Estate Market Report Q1 2026: Record Transactions, Resilient Prices & Investor Opportunities
Want to know which Q1 2026 hotspot suits your budget? Book a free consultation with our team →
Dubai's real estate market delivered one of its most remarkable quarters in history during Q1 2026. Despite regional geopolitical tensions making international headlines, the market posted record-breaking transaction values, sustained volume growth, and price appreciation that signals a maturing — not peaking — market.
This report breaks down the numbers month by month, identifies the hottest investment areas, and gives you the data you need to make confident decisions in 2026.
Executive Summary: Q1 2026 in Numbers
| Metric | Q1 2026 Value | Trend |
|---|---|---|
| Monthly Transaction Volume | 20,500+ | ↑ All-time high |
| January Sales Value | AED 107.96 billion | ↑ Historic record |
| Off-Plan Market Share | 65%+ | ↑ Growing dominance |
| Cash Purchase Percentage | 87% | ↑ Increasing stability |
| Median Price Growth (YoY) | 15% | Healthy deceleration |
| Off-Plan Price Premium | 31% over ready market | ↑ Widening opportunity |
The headline: January 2026 became Dubai's highest-ever monthly property sales month, with AED 107.96 billion in total transactions — a figure that would have seemed impossible just four years ago when annual totals were at similar levels.
January 2026: The Historic Peak
January shattered every record Dubai's property market has ever seen.
| Metric | Value | YoY Change |
|---|---|---|
| Total Transactions | 21,884 | +17.27% |
| Total Value | AED 107.96 billion | +86.5% |
| Sales Transactions | 16,858 | +20.38% |
| Sales Value | AED 70.05 billion | +59.13% |
| Mortgage Activity | AED 32.04 billion (4,160 transactions) | — |
| Property Gifts | AED 5.87 billion (826 transactions) | — |
Top 5 Areas by Sales Value (January 2026):
- Al Rowaiyah 1 — AED 6.31 billion
- Meydan 2 (Me'aisem 2) — AED 6.04 billion
- Al Yalayis 1 — AED 4.6 billion
- Business Bay — AED 3.51 billion
- Sheikh Mohammed bin Rashid Gardens — AED 3.26 billion
The surge was driven by a wave of off-plan registrations from late 2025 launches settling into the DLD system, combined with HNWI capital inflows from Europe, Russia, and South Asia — buyers choosing Dubai as a safe-haven asset destination.
February 2026: Sustained Momentum
February confirmed January was not an outlier — demand remained structurally elevated.
| Metric | Value | YoY Change |
|---|---|---|
| Total Sales | 16,959 transactions | +5% |
| Total Sales Value | AED 60.60 billion | +18.14% |
| Off-Plan Sales | 10,526 transactions (62% share) | — |
| Ready Sales | 6,437 transactions (38% share) | — |
| Mortgage Transactions | 3,867 totaling AED 16.43 billion | — |
Property Type Performance (February 2026 vs 2025):
| Property Type | Transactions | Value | YoY Transactions | YoY Value |
|---|---|---|---|---|
| Apartments | 12,820 | AED 26.6B | +12.6% | +22.6% |
| Villas | 1,563 | AED 6.4B | -60.6% | -67.5% |
| Commercial | 717 | AED 9.54B | +61.9% | +695% |
The commercial sector's 695% YoY value growth stands out — driven by institutional investors diversifying beyond residential into retail and office assets as Dubai's economy diversifies.
Top Areas by Volume (February): Jumeirah Village Circle (1,146), Al Yelayiss 1 (916), Madinat Al Mataar (828), Dubai Land Residence Complex (750), Business Bay (733).
March 2026: Resilience Under Pressure
Curious what your current Dubai property is worth at Q1 2026 prices? Get your instant, no-obligation valuation →
March tested the market — regional uncertainty intensified and the DFM Real Estate Index dropped approximately 30% from its February peak. Yet property transactions held firm.
Weekly data (last week of March 2026):
- Total Transactions: 4,089
- Total Value: AED 14.34 billion
- Off-Plan Sales: AED 4.86 billion (53% of sales value)
- Secondary Sales: AED 4.25 billion
- Cash Purchases: 87% of all transactions
Even more telling: after the initial uncertainty spike, viewing activity increased 75% as buyers recognised the disconnect between sentiment-driven stock indices and the physical property market's fundamentals.
This is the pattern Dubai has shown consistently — geopolitical noise creates short-term hesitation, not structural correction.
Price Trends: Q1 2026 vs Q1 2025
| Metric | Q1 2025 | Q4 2025 | Q1 2026 | YoY Change |
|---|---|---|---|---|
| Median PSF (Residential) | AED 1,580 | AED 1,692 | AED 1,818 | +15% |
| Off-Plan Median PSF | AED 1,750 | AED 1,820 | AED 1,950 | +11.4% |
| Ready Market Median PSF | AED 1,380 | AED 1,430 | AED 1,510 | +9.4% |
| Off-Plan Premium | 27% | 28% | 31% | +4 percentage points |
Price growth is decelerating from its 26.9% peak in 2022 toward 15% — which is actually a healthier signal. Hypergrowth attracts speculative capital and regulatory intervention. Sustainable growth at 10–15% annually attracts long-term investors and end-users.
Property Type Price Breakdown (Q1 2026):
| Property Type | Median PSF | YoY Change | Transaction Share |
|---|---|---|---|
| Apartments | AED 1,729 | +9.2% | 72% |
| Villas | AED 1,468 | +14.1% | 18% |
| Townhouses | AED 1,385 | +11.8% | 8% |
| Penthouses | AED 3,200+ | +21.3% | 2% |
Hottest Investment Areas in Q1 2026
Jumeirah Village Circle (JVC) — Best Yield-to-Price Ratio
- 20,278 transactions in 2025 — highest liquidity community in Dubai
- AED 1,475/sqft median price
- 5.7% gross rental yield — best ratio among high-volume areas
- Ideal for investors seeking cash flow with capital growth upside
Dubai Hills Estate — Premium Mid-Market Leader
- 4,275 transactions in 2025
- AED 2,413/sqft median price
- +18% YoY price growth
- Strong end-user demand, proximity to schools and mall
Business Bay — The Transformation Play
- AED 2,108/sqft and rising
- 5,840 transactions in 2025, +15% YoY residential price growth
- Rapidly evolving from commercial district to 24-hour mixed-use community
- DIFC worker rental demand creating sustained yield pressure
Palm Jumeirah & Branded Residences — Luxury Staying Strong
- AED 2,800–3,100/sqft price range
- Branded residences commanding 30–50% premium over comparable non-branded units
- International buyer demand unaffected by regional tensions
Why the Market Stays Resilient: The 5 Structural Reasons
1. Cash-driven, not leverage-driven
87% of transactions are cash purchases. No mortgage-driven forced selling. No cascade effect from rate rises.
2. Population growth is structural
Dubai adds 100,000+ residents annually. Demand is not speculative — it is demographic.
3. Supply is controlled, not free-flowing
The 150,000+ units announced for 2025–2027 spread over three years equals roughly 50,000 units per year. Dubai's absorption rate (215,060 transactions in 2025) exceeds supply by more than 4:1.
4. Government policy actively supports the market
Golden Visa (AED 2M+ threshold), corporate relocations post-pandemic, and the Dubai 2040 Master Plan provide a 15-year framework for sustained growth.
5. Transactions are the leading indicator, not stock indices
The DFM Real Estate Index dropped 30% while physical property transactions rose 17%. Stock markets price fear. Property markets price fundamentals.
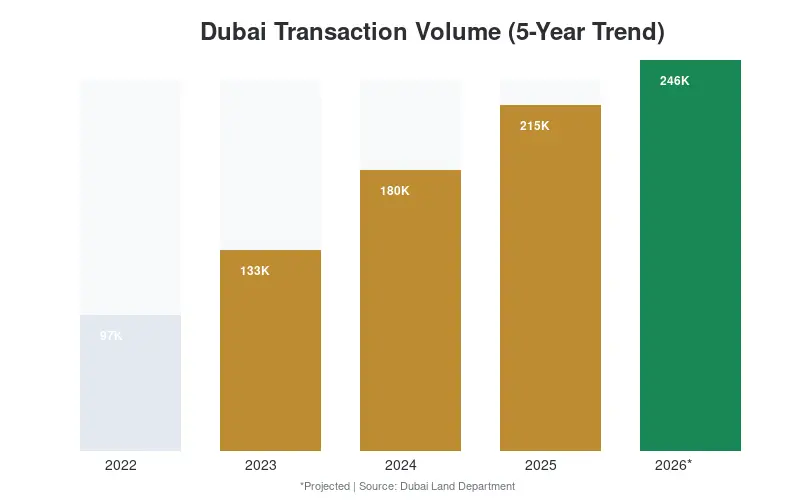
Transaction Volume: 5-Year Trajectory
| Year | Annual Transactions | YoY Change |
|---|---|---|
| 2022 | 97,458 | — |
| 2023 | 133,134 | +37% |
| 2024 | 179,756 | +35% |
| 2025 | 215,060 | +20% |
| 2026 (projected) | 246,000+ | +14% |
The growth rate is decelerating but the absolute volumes are still climbing. Each year sets a new record not through speculation but through organic demand from a growing, diversifying city.
What This Means for Investors: Q1 2026 Action Plan
If you are buying off-plan:
The 31% price premium over ready properties reflects genuine demand — developers are raising prices 5–10% per launch phase. Early entry into new masterplanned communities (Dubai South, DAMAC Lagoons, Emaar South) captures this step-up cycle.
If you are holding ready property:
9.4% ready market price growth with 5–6% gross yields in high-liquidity areas (JVC, Business Bay) creates a total return of 14–16% annually. This compares favourably with most global real estate markets.
If you are concerned about the geopolitical situation:
The data from March 2026 is definitive: 87% cash purchases mean no leverage unwind. Viewing activity increased 75% after the initial fear spike. Long-term holders who sold during previous regional tensions (2014–2016) recovered fully within 24 months. Those who held, won.
If you are new to Dubai real estate:
JVC offers the entry point with the best yield-to-price ratio. Dubai Hills and Business Bay offer the best capital appreciation profile. Palm Jumeirah and branded residences offer the strongest store-of-value characteristic.
Ready to Act on the Q1 2026 Market Data?
✔ Free market consultation — we walk you through the Q1 2026 data for your target area ✔ Off-plan access — pre-launch allocations in JVC, Dubai Hills, Business Bay, and Palm Jumeirah ✔ Instant property valuation — know exactly where you stand at today’s prices
Call / WhatsApp: +971 566914193 / +971-56-161-5675
Visit Our Website: https://earlybirdsproperties.com/
Get exclusive access to the best Dubai real estate opportunities — before they hit the market.
Frequently Asked Questions
What was Dubai total real estate transaction value in Q1 2026?
January 2026 alone recorded AED 107.96 billion in transactions — the highest single month in Dubai history. Q1 2026 combined exceeded AED 230 billion across 55,000+ transactions, marking a record-breaking quarter driven by 87% cash purchases and strong international investor demand.
What percentage of Dubai property purchases are cash?
87% of all Dubai real estate transactions in Q1 2026 were cash purchases. This is a key stability indicator — unlike leveraged markets, Dubai property is not vulnerable to interest rate rises or mortgage-driven forced selling.
Which areas had the highest transaction volume in Q1 2026?
Jumeirah Village Circle (JVC) led with 1,146 transactions in February alone. Other top areas included Al Yelayiss 1 (916), Business Bay (733), Dubai Hills Estate, and Dubai Land Residence Complex. JVC remains Dubai highest-liquidity residential community.
What are the best areas to invest in Dubai in 2026?
For yield-focused investors: JVC offers 5.7% gross rental yields at AED 1,475/sqft. For capital appreciation: Dubai Hills Estate (+18% YoY) and Business Bay (+15% YoY). For luxury/store of value: Palm Jumeirah and branded residences commanding 30-50% premiums.
Will Dubai property prices crash in 2026?
Q1 2026 data suggests no. Despite the DFM Real Estate Index dropping 30% on regional uncertainty, physical property transactions rose 17% and viewing activity increased 75%. The 87% cash-buyer market structure prevents leverage-driven corrections seen in Western markets.
What is the off-plan vs ready property price difference in Dubai?
Off-plan properties in Q1 2026 trade at a 31% premium over ready properties (AED 1,950/sqft vs AED 1,510/sqft median). This premium reflects genuine demand and developer price escalation of 5-10% per launch phase — early entry captures the step-up cycle.