
Dubai Property Market August 2026: 12,018 Sales Worth AED 28.6 Billion
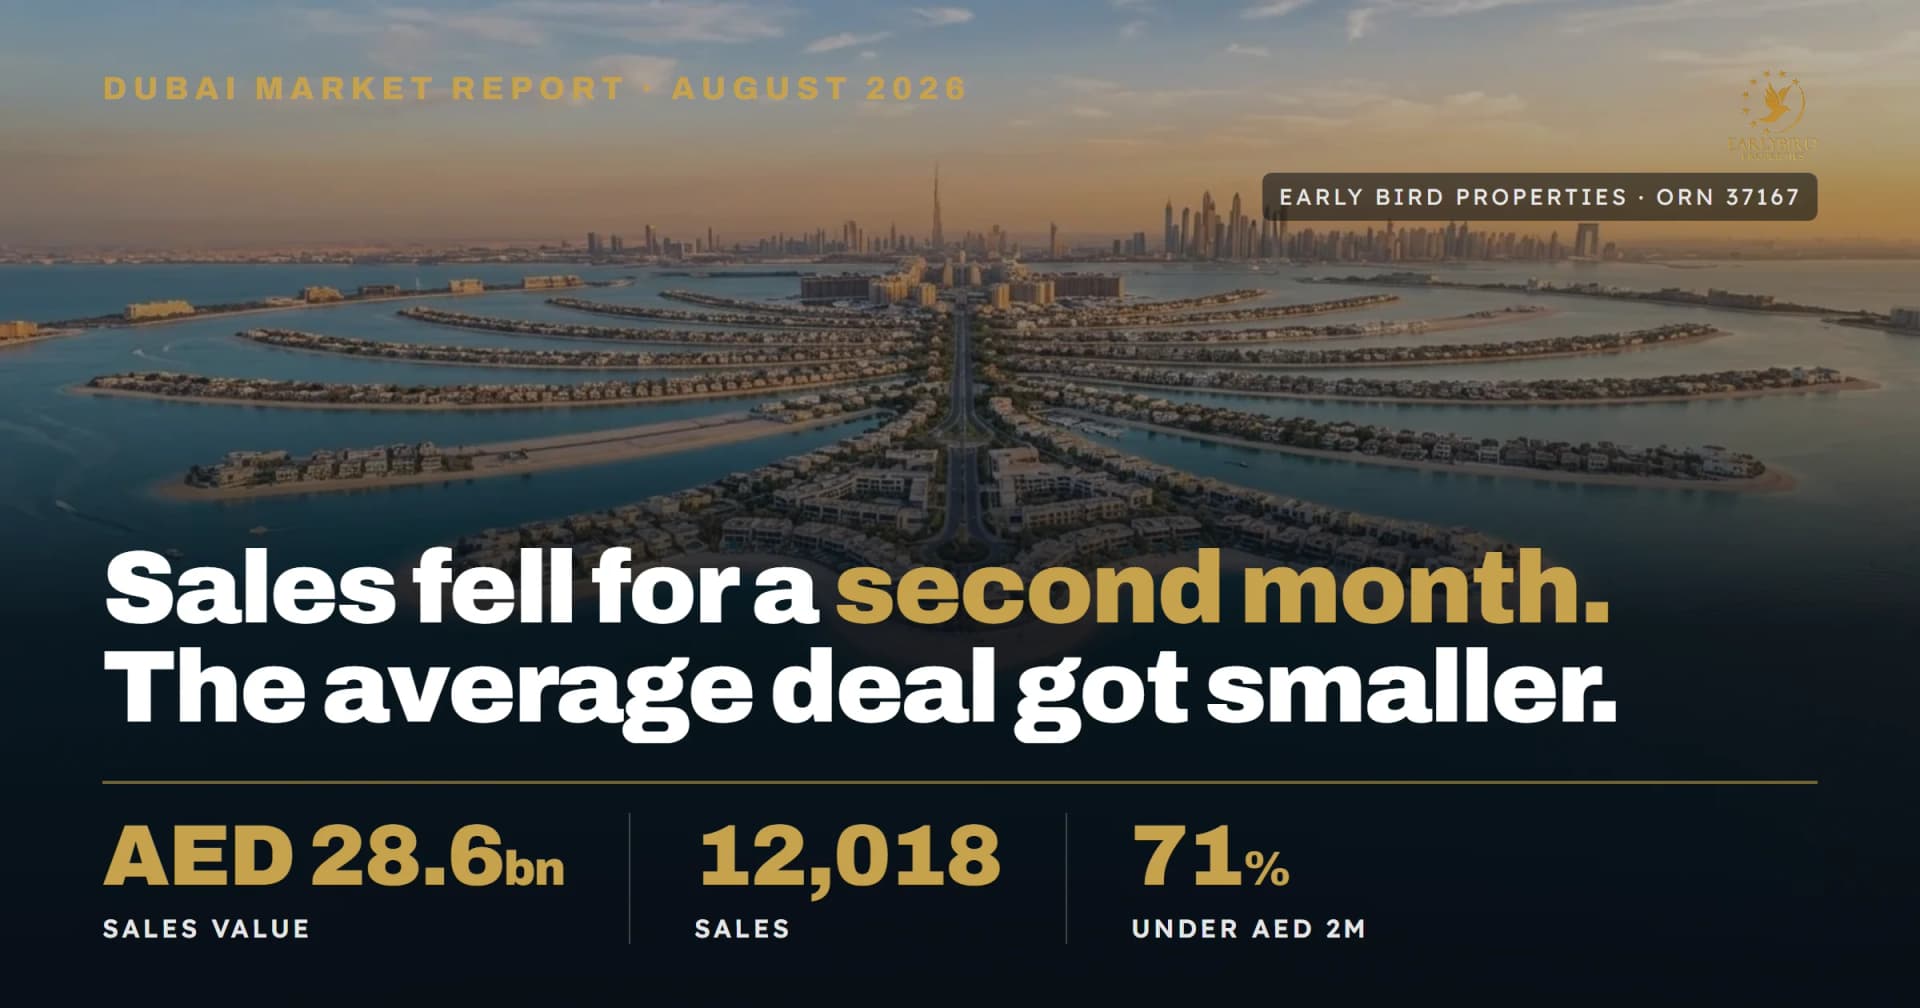
Dubai recorded 12,018 property sales worth AED 28.6 billion in August 2026, down 15% on July and 35.9% on August 2025. The average transaction was AED 2.38 million; 71% of sales were under AED 2 million.
Figures measure sales transactions registered with the Dubai Land Department plus DIFC registrations, excluding mortgage registrations and gift transfers. Data as of August 2026 · Published September 2026.
| AED 28.6bn | 12,018 sales | 71% under AED 2m |
|---|---|---|
| Sales value, Aug 2026 (sales basis) | Sales transactions, Aug 2026 (sales basis) | Share of Aug 2026 sales volume under AED 2m |
What you need to know
✓ Dubai recorded 12,018 property sales in August 2026, worth AED 28.6 billion (sales basis).
✓ Sales volume fell 15% on July and 35.9% on August 2025.
✓ Sales value fell 18% on July and 44.2% on August 2025 — faster than volume.
✓ The average transaction was AED 2.38 million, against AED 2.49 million in July.
✓ 71% of sales were under AED 2 million; only 7% were above AED 5 million.
✓ Dubai South led all areas for the third straight period, with roughly 2,000 sales.
How to read these numbers
Every figure here uses the sales basis: sale transactions registered with the Dubai Land Department plus DIFC registrations; excludes mortgage registrations and gift transfers.
Figures published elsewhere on a total basis include mortgages and gifts, larger by definition — not comparable with the sales figures used throughout.
Volume counts properties sold; value counts what they were worth combined. The two can move at different speeds — August is a case where they did.
The month in numbers
| Measure | August 2026 | vs July | vs August 2025 |
|---|---|---|---|
| Sales transactions | 12,018 | -15% | -35.9% |
| Sales value | AED 28.6bn | -18% | -44.2% |
| Average transaction | AED 2.38m | AED 2.49m in July | -13.0% (derived) |
Value fell further than volume — fewer deals happened in August, and each deal was smaller on average than the same month last year.
August is the second-lowest month of the past twelve
| Month | Sales transactions (sales basis) |
|---|---|
| Sep 2025 | ≈20,000 |
| Oct 2025 | ≈20,000 |
| Nov 2025 | ≈19,000 |
| Dec 2025 | ≈19,000 |
| Jan 2026 | ≈17,000 |
| Feb 2026 | ≈17,000 |
| Mar 2026 | ≈13,000 |
| Apr 2026 | ≈14,000 |
| May 2026 | ≈10,000 |
| Jun 2026 | ≈14,000 |
| Jul 2026 | ≈14,000 |
| Aug 2026 | 12,018 |
Only one month in the past twelve, at roughly 10,000 sales, sits below August's 12,018. The three most recent months read 14,000, 14,000, then 12,018 — a step down, not a plateau.
Our read, labelled as opinion: July's report described stabilisation across 10,000, 14,000, 14,000. August's 12,018 does not support that — 14K, 14K, 12K is a step down, not a floor.
Some of the year-on-year decline is also amplified by an unusually strong comparison base — 2025's second half ran 19,000 to 20,000 sales a month.
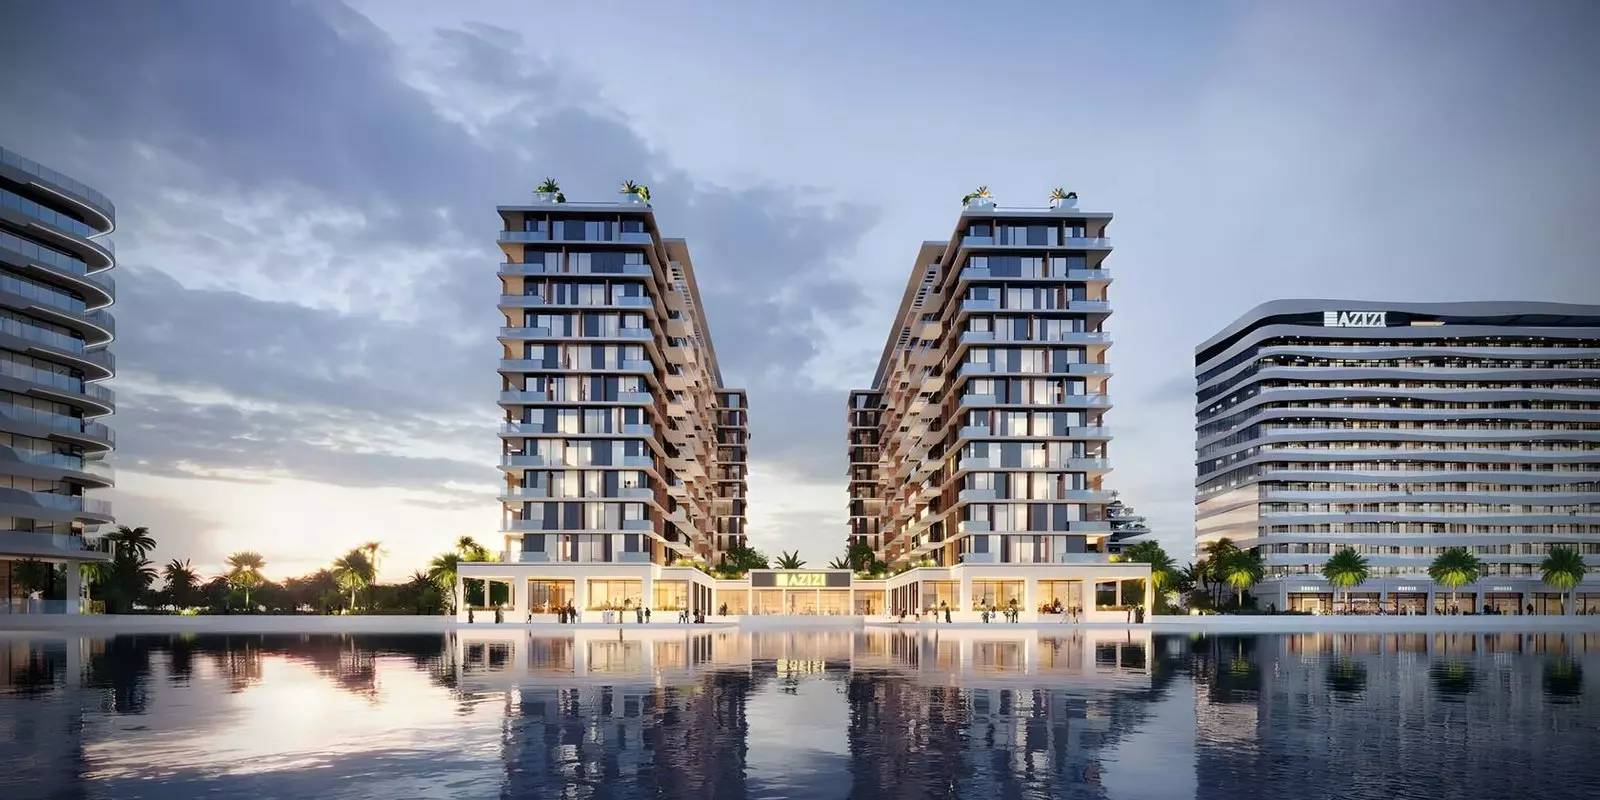
Azizi Venice, Dubai South — indicative listing, subject to developer confirmation.
Message us on WhatsApp and we will send you the transaction picture for your area — free, no pitch. Prefer a call? Book a consultation. Early Bird Properties · DLD ORN 37167 · working from the registered transaction record.
Why value fell faster than volume
| Property type | Sales | vs July | vs Aug 2025 | Sales value |
|---|---|---|---|---|
| Apartments | 9,974 | -16.9% | -37.4% | AED 15.7bn |
| Villas | 1,354 | +0.3% | -32.8% | AED 7.9bn |
| Commercial | 420 | -19.7% | -5.6% | AED 1.5bn |
| Plots | 183 | -29.3% | -47.4% | AED 2.6bn |
These four rows sum to 11,931 sales and AED 27.7bn, against month totals of 12,018 and AED 28.6bn — an 87-sale, 0.7% gap from rounding and unlisted categories.
71% of sales were below AED 2 million
| Price band | Share of August 2026 sales volume |
|---|---|
| Under AED 1M | 40% |
| AED 1M - 2M | 31% |
| AED 2M - 3M | 12% |
| AED 3M - 5M | 9% |
| Above AED 5M | 7% |
These price-band shares are as compiled and sum to 99% through rounding.
| Category | Share of August 2026 sales value |
|---|---|
| Apartment | 55% |
| Villa | 28% |
| Plot | 9% |
| Commercial | 5% |
| Building | 3% |
Volume is not value. A single AED 100 million penthouse adds as much to the month's value as roughly 140 sales at AED 700,000, while counting once in volume.
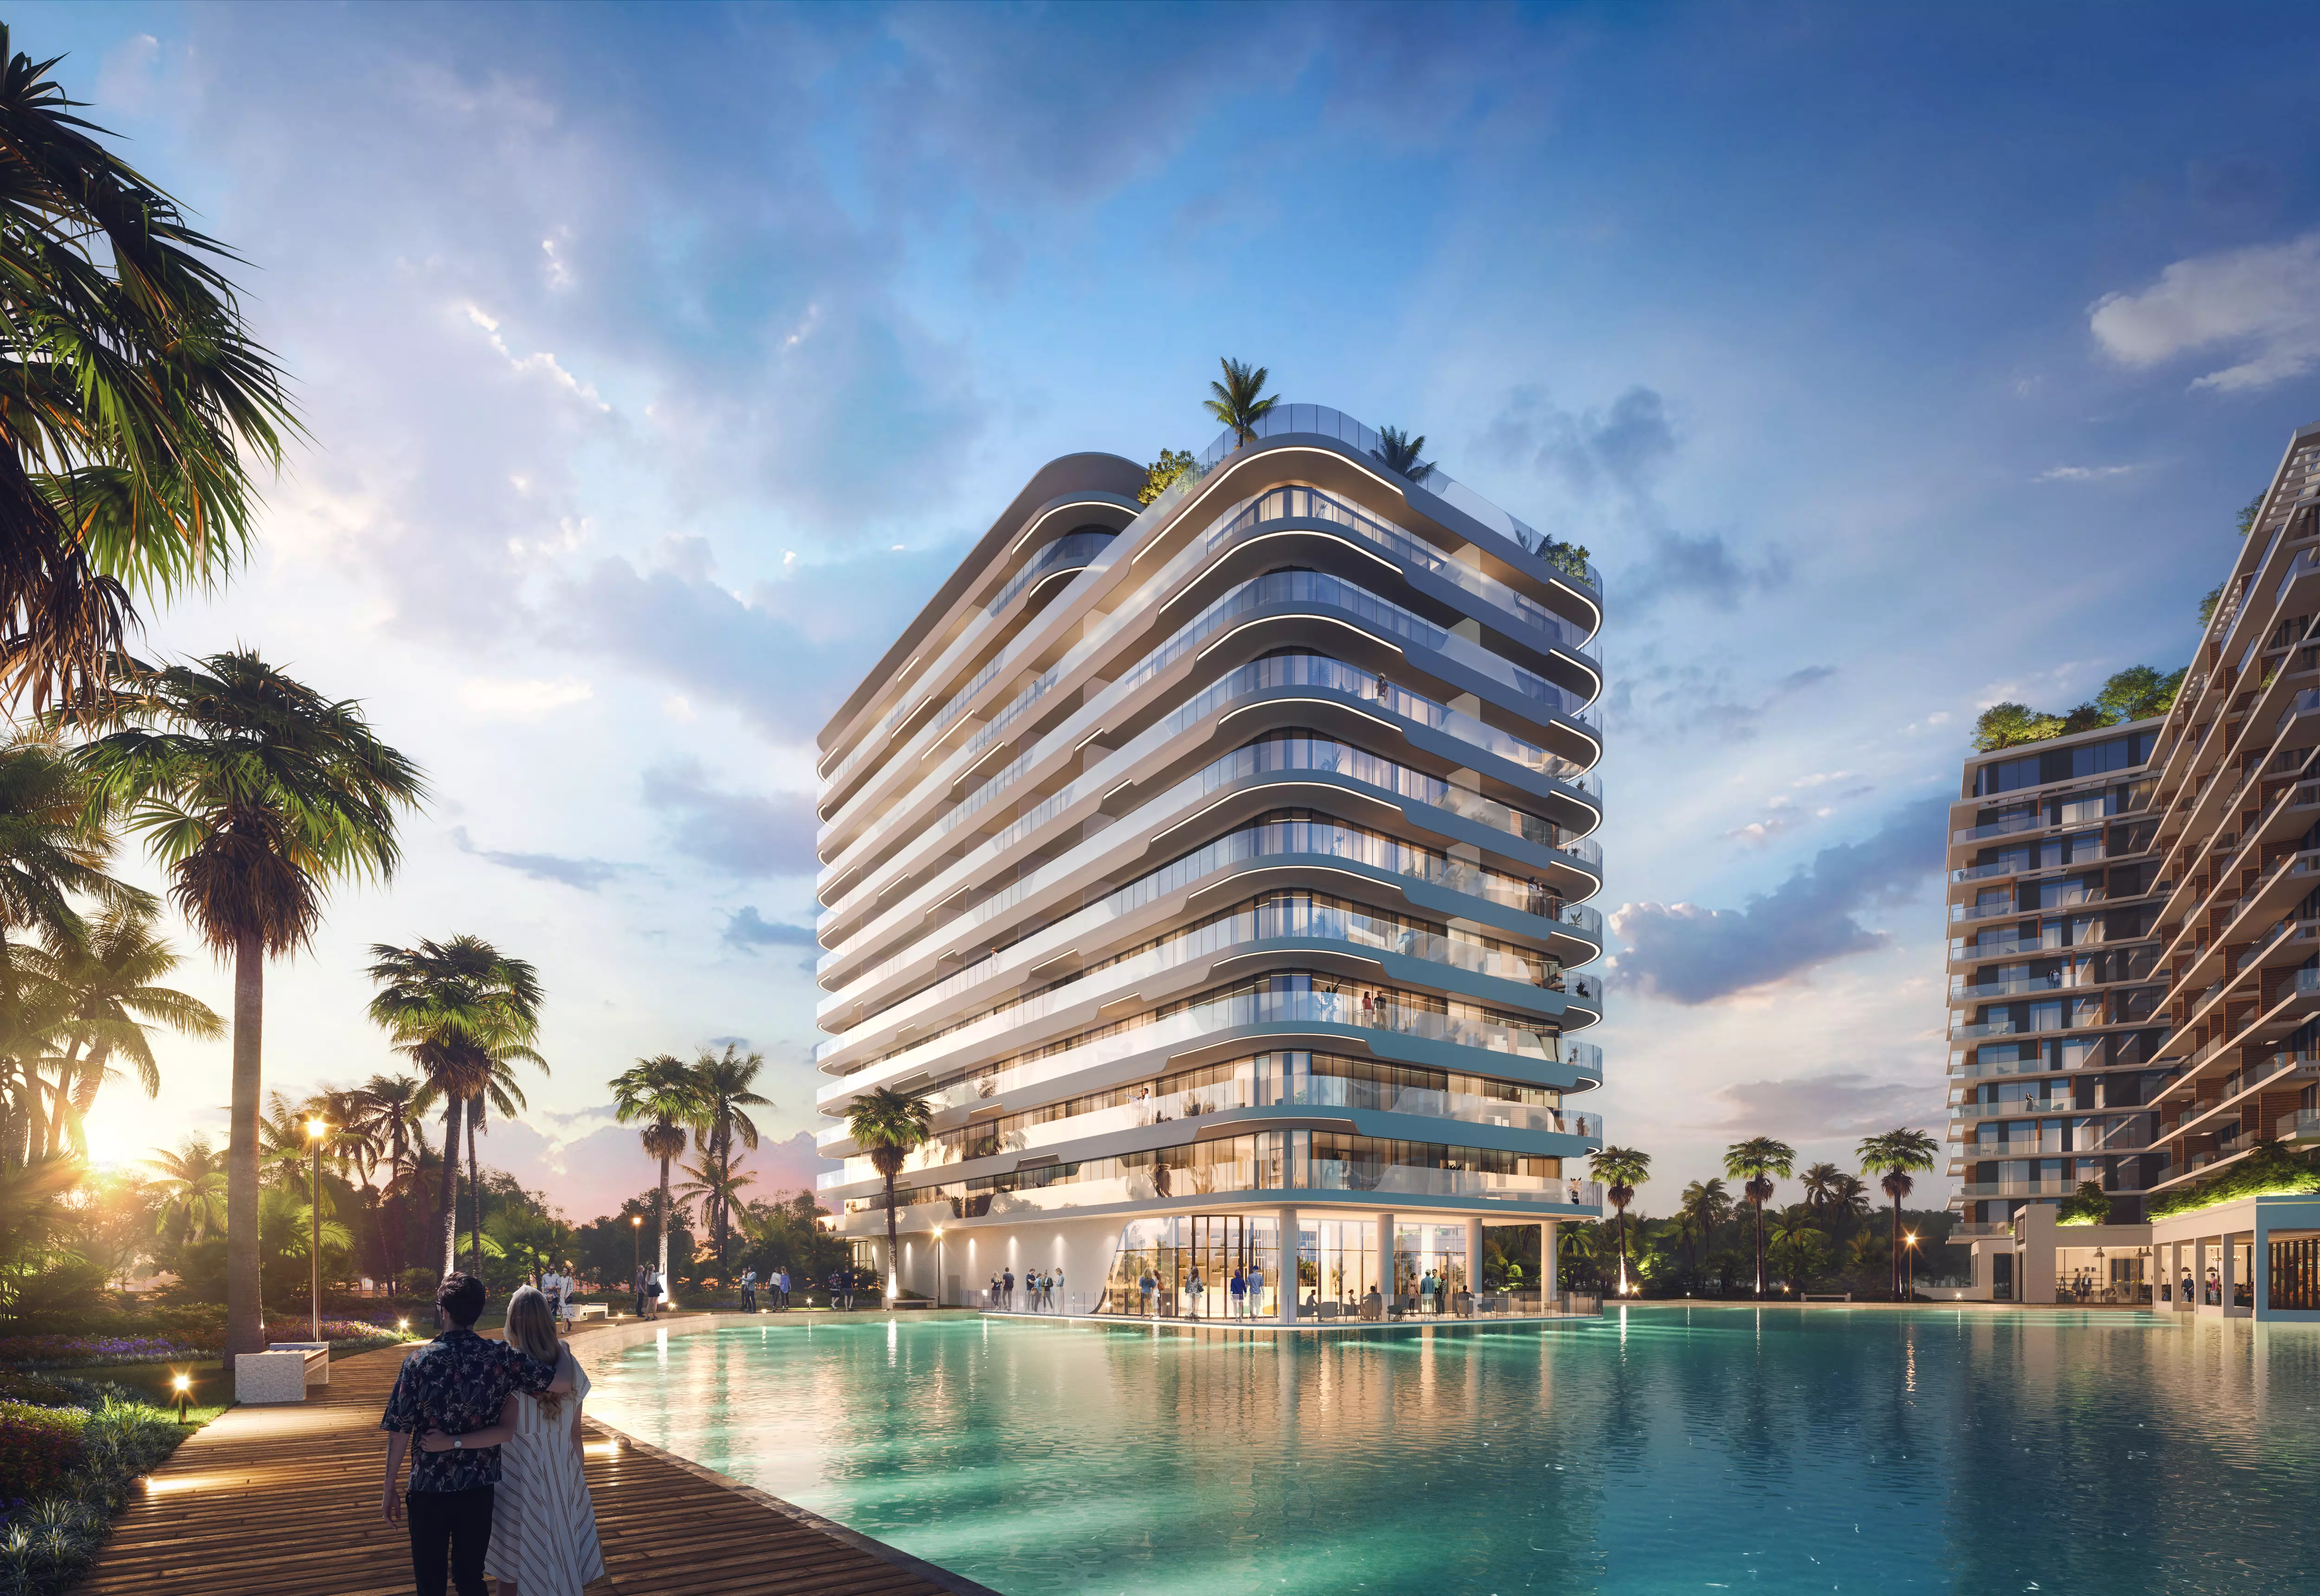
Entry-segment stock in Dubai South — indicative listing, subject to developer confirmation.
Where the deals happened
The five most active areas by sales volume in August 2026, ranking only:
| Rank | Area (sales basis, ranking only) |
|---|---|
| 1 | Dubai South (≈2,000 sales) |
| 2 | Wadi Al Safa 4 |
| 3 | Al Barsha South Fourth |
| 4 | Jebel Ali |
| 5 | Wadi Al Safa 5 |
Counts for places two through five are not stated. Dubai South led Q2, July, and now August — the only area to top all three periods. Wadi Al Safa 5 replaces Jabal Ali First against July's ranking.
None is a legacy prime district. They sit along Dubai's southern and western growth corridor, near the Al Maktoum Airport expansion and Expo City — dominated by off-plan stock at accessible entry prices, such as Azizi Venice.
The derived read
Two figures here do not appear in the source data as published — our own calculation, arithmetic shown so it checks out. Volume fell 35.9% year-on-year, value fell 44.2%. If only deal count had changed, those would match; they do not, so the average transaction also shrank. As index numbers: volume is 0.641 of its August 2025 level (1 minus 0.359), value is 0.558 (1 minus 0.442). Value divided by volume gives the average-ticket index: 0.558 ÷ 0.641 = 0.870, a 13.0% year-on-year fall. Multiplying back confirms it closes exactly: 0.641 × 0.870 = 0.558, matching the published value index — the check that this is a real figure, not rounding. In levels: AED 2.38 million per sale in August against AED 2.49 million in July. Villas alone did not fall month-on-month, up 0.3% on 1,354 sales — a small-base data point, not a trend, but it breaks July's pattern, when villas fell hardest. Commercial carried a higher ticket than apartments yet fell least. So "the expensive end fell hardest" is not a rule this data supports — apartments and plots led the decline, not villas or commercial.
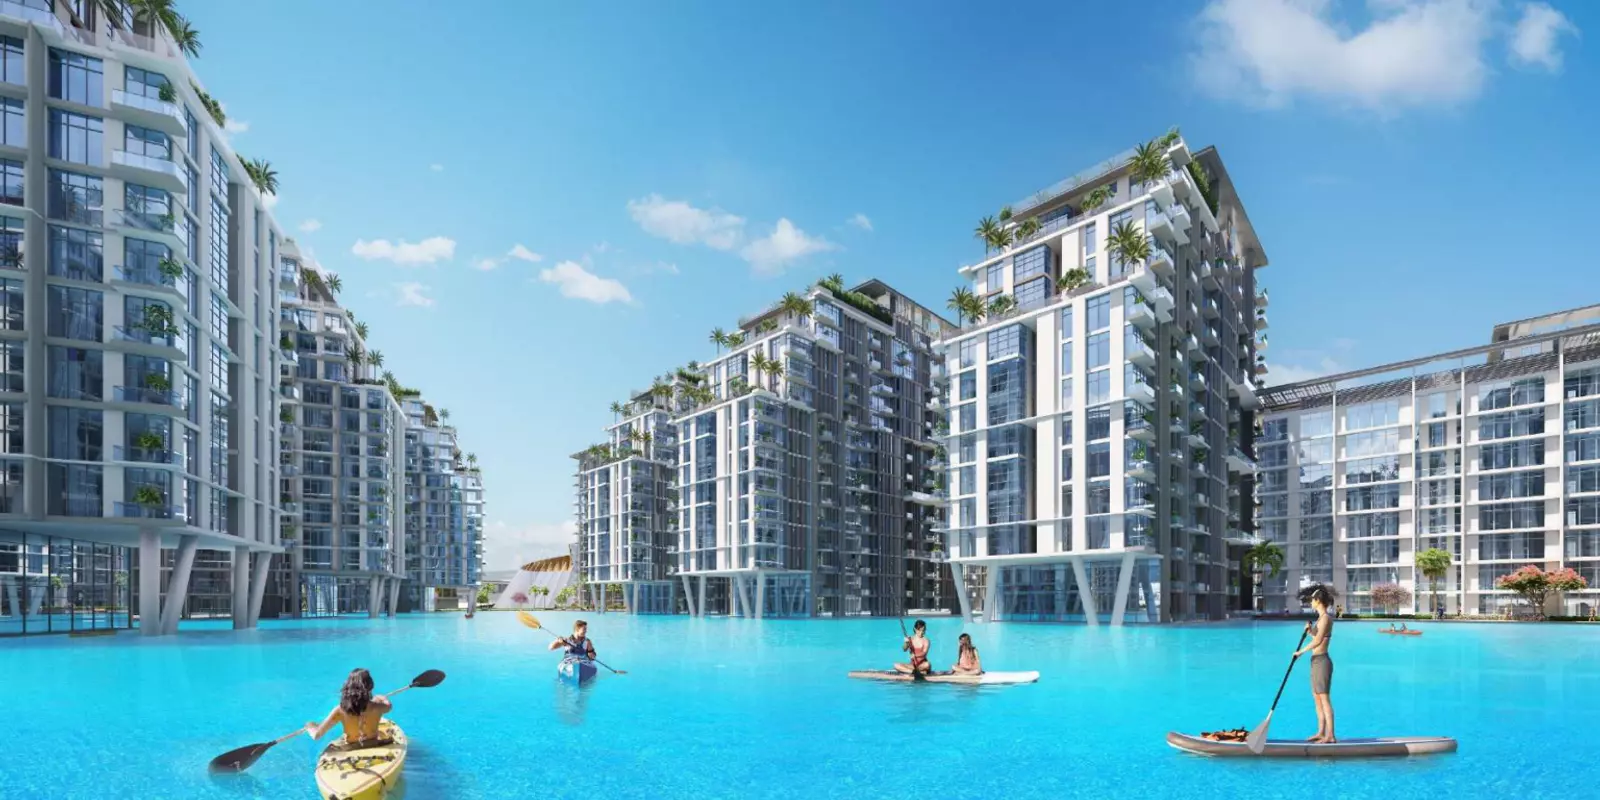
Dubai South — the most active sales area in Q2, July and August 2026.
What the data shows for buyers
12,018 sales is 35.9% below August 2025. 71% of sales were under AED 2 million, and above AED 3 million is a combined 16% of volume.
The most active areas were Dubai South, Wadi Al Safa 4, Al Barsha South Fourth, Jebel Ali and Wadi Al Safa 5.
Tell us the area and price band you are weighing up and we will send you what actually sold there.
Frequently asked questions
How many properties were sold in Dubai in August 2026?
Dubai recorded 12,018 property sales in August 2026, worth AED 28.6 billion combined. This counts direct sale transactions registered with the Dubai Land Department plus DIFC registrations, excluding mortgage registrations and gift transfers, which are reported separately on a larger total basis measure.
Why did Dubai sales value fall faster than volume in August 2026?
Volume fell 35.9% year-on-year while value fell 44.2%, so the average transaction shrank too, by 13.0%, to AED 2.38 million. Apartments and plots led the decline; villas and commercial fell least, breaking the pattern of the expensive end falling hardest.
Which area in Dubai had the most property sales in August 2026?
Dubai South led all areas with roughly 2,000 sales, followed by Wadi Al Safa 4, Al Barsha South Fourth, Jebel Ali and Wadi Al Safa 5. Dubai South also led Q2 and July — the only area to top all three periods.
How much do most properties in Dubai actually cost?
Most Dubai property sales sit well below its luxury reputation. In August 2026, 40% of transactions were under AED 1 million and 71% under AED 2 million. Only 7% exceeded AED 5 million — shares of sales volume, not total market value.
Is the Dubai property market falling in 2026?
Sales volume is falling: August 2026 recorded 12,018 sales worth AED 28.6 billion, down 15% on July. The year-on-year falls of 35.9% on volume and 44.2% on value are measured against an unusually strong 2025 base, when monthly sales ran 19,000 to 20,000. Slower, on a smaller average deal.
Where can I read the full August 2026 report?
The full report is a 7-page PDF — download the August 2026 report — covering the same figures in more depth with additional data tables. For a specific area or price band, message us on WhatsApp and we will send you what actually sold there.
Methodology and sources
All figures are compiled from Dubai Land Department transaction records plus DIFC registrations for August 2026, sales basis, excluding mortgage registrations and gift transfers. Public transaction data is available at dubailand.gov.ae under Open Data.
Figures published elsewhere on a total basis include mortgages and gifts, larger by definition; not comparable here. Widely reported DLD-basis sales for August 2026: 11,600 sales, AED 27.89bn; the gap reflects DIFC coverage and basis.
Derived numbers — the average transaction and its year-on-year change — are our own calculations, arithmetic shown above. Price-band shares sum to 99% as compiled; area results are a ranking only.
We do not publish average price-per-square-foot figures; every building carries its own.
Related: Q2 2026 report (total basis, not comparable) · DLD transactions, Q1 vs Q2 2026 · off-plan versus resale in Dubai.
This article is market commentary and general information, not financial, investment, tax, or legal advice, and not an offer or solicitation. Property values can fall as well as rise. Early Bird Real Estate LLC · DLD ORN 37167.

Muhammad Zohaib Saleem — Founder, Early Bird Properties (RERA / DLD ORN 37167). In Dubai real estate since 2013.
Zohaib publishes Early Bird's monthly market pulse from primary Dubai Land Department and DIFC registration data, with metric definitions stated in full so readers can check figures against the source.
No developer marketing fees; recommendations based solely on investor interest alignment.
Download the 7-page August 2026 report (PDF)
Ask us about your area on WhatsApp
Prefer to read first? Our full library of Dubai market reports is on the market insights hub, including July's report.