
Dubai Property Market July 2026: 13,872 Sales Worth AED 34.5 Billion
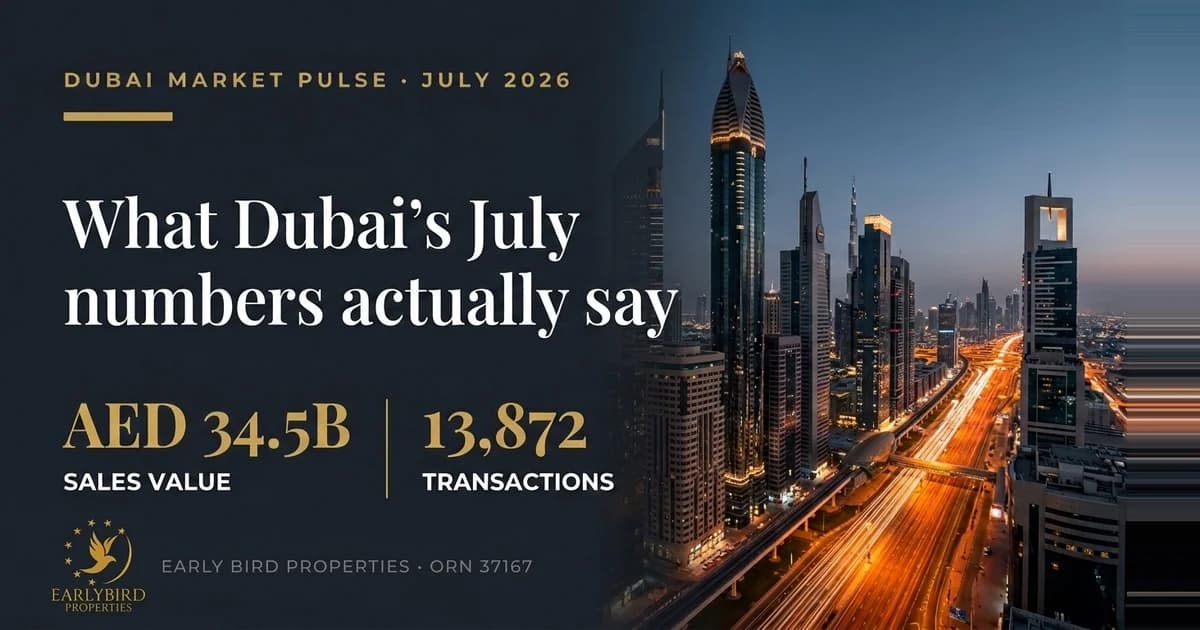
Dubai recorded 13,872 property sales worth AED 34.5 billion in July 2026, according to DXB Interact's monthly report drawn from Dubai Land Department and DIFC registrations. Sales value rose 3.9% from June while transaction volume was essentially flat at -0.4%. Against July 2025 the same figures read -31.6% on volume and -46.9% on value — and that year-on-year gap deserves a direct explanation rather than a headline. July 2026 is being measured against mid-2025, when Dubai was registering 19,000 to 20,000 sales a month, roughly 40% above July's level. Comparing a normal month to an exceptional run produces a large negative number without a market actually falling apart. The month-on-month picture, which compares like with like, shows value rising on flat volume.
Superseded. The August 2026 edition is now live: Dubai Property Market August 2026 — 12,018 sales worth AED 28.6 billion. This July report stays online as the previous period.
What Dubai's July 2026 Property Numbers Actually Say
All figures in this article measure sales transactions only — direct sales registered with the Dubai Land Department plus DIFC registrations. They exclude mortgage registrations and gift transfers, which is why they will not match the larger "total transactions" figures published elsewhere — for the second quarter of 2026, the sales-only count was 38,257 against 51,170 on the total measure. Comparing one family to the other is the most common way Dubai market numbers get misread. Source: DXB Interact, July 2026 monthly report.
| Measure (sales only) | July 2026 | vs June 2026 | vs July 2025 |
|---|---|---|---|
| Transaction volume | 13,872 sales | -0.4% | -31.6% |
| Transaction value | AED 34.5 billion | +3.9% | -46.9% |
The interesting number in that table is not the largest one. It is the pairing of +3.9% value against -0.4% volume. Roughly the same number of properties changed hands in July as in June, but they were collectively worth more — meaning the average transaction was larger. What that reflects in terms of which segments moved cannot be settled from a single month's data, since the comparable June price-band breakdown is not published alongside it.
What Is Actually Behind Dubai's -46.9% Year-on-Year Figure
A -46.9% year-on-year drop in transaction value is a genuinely large number and it should not be buried in a footnote. Here is what sits underneath it. Dubai's monthly sales volumes across the twelve months to July 2026 ran, in round figures: 19,000, 20,000, 20,000, 19,000, 19,000, 17,000, 17,000, 13,000, 14,000, 10,000, 14,000, and 14,000. The market spent the second half of 2025 running at 19,000 to 20,000 sales a month. Every year-on-year comparison published for the rest of 2026 will be measured against that stretch, which sits roughly 40% above where the market has settled.
Fewer transactions is only part of the explanation, and the arithmetic makes that plain. Volume fell 31.6% year-on-year but value fell 46.9%. If the only thing that had changed were the number of deals, both figures would match. The gap means the average transaction also got smaller — by roughly 22% year-on-year, from about AED 3.2 million in July 2025 to about AED 2.5 million in July 2026. Dubai in July 2026 sold fewer properties and cheaper ones.
The property-type breakdown shows where that came from. Villa sales numbered 1,322 in July, down 56.4% year-on-year, against 11,759 apartment sales down 27.6%. Villas carry a far higher average ticket than apartments, so a villa segment contracting at twice the rate of the apartment segment pulls the market-wide average down on its own. That is a villa story specifically rather than a blanket rule about expensive property — commercial sales, which carry a higher average ticket than apartments, fell the least of any segment at -15.2%.
The honest reading, then, is that Dubai has stepped down from an unusually active run to a slower level, with the upper segments cooling fastest. Buyers who anchor to late-2025 conditions will misread the market they are actually buying into. It is also worth noting where the sequence bottomed: the 10,000-sale month in the series is the low point, and July's 13,872 sits meaningfully above it. The three most recent months read 10,000, 14,000, 14,000 — a stabilisation over that stretch rather than a continued slide, though three months is a short window on which to call a floor.
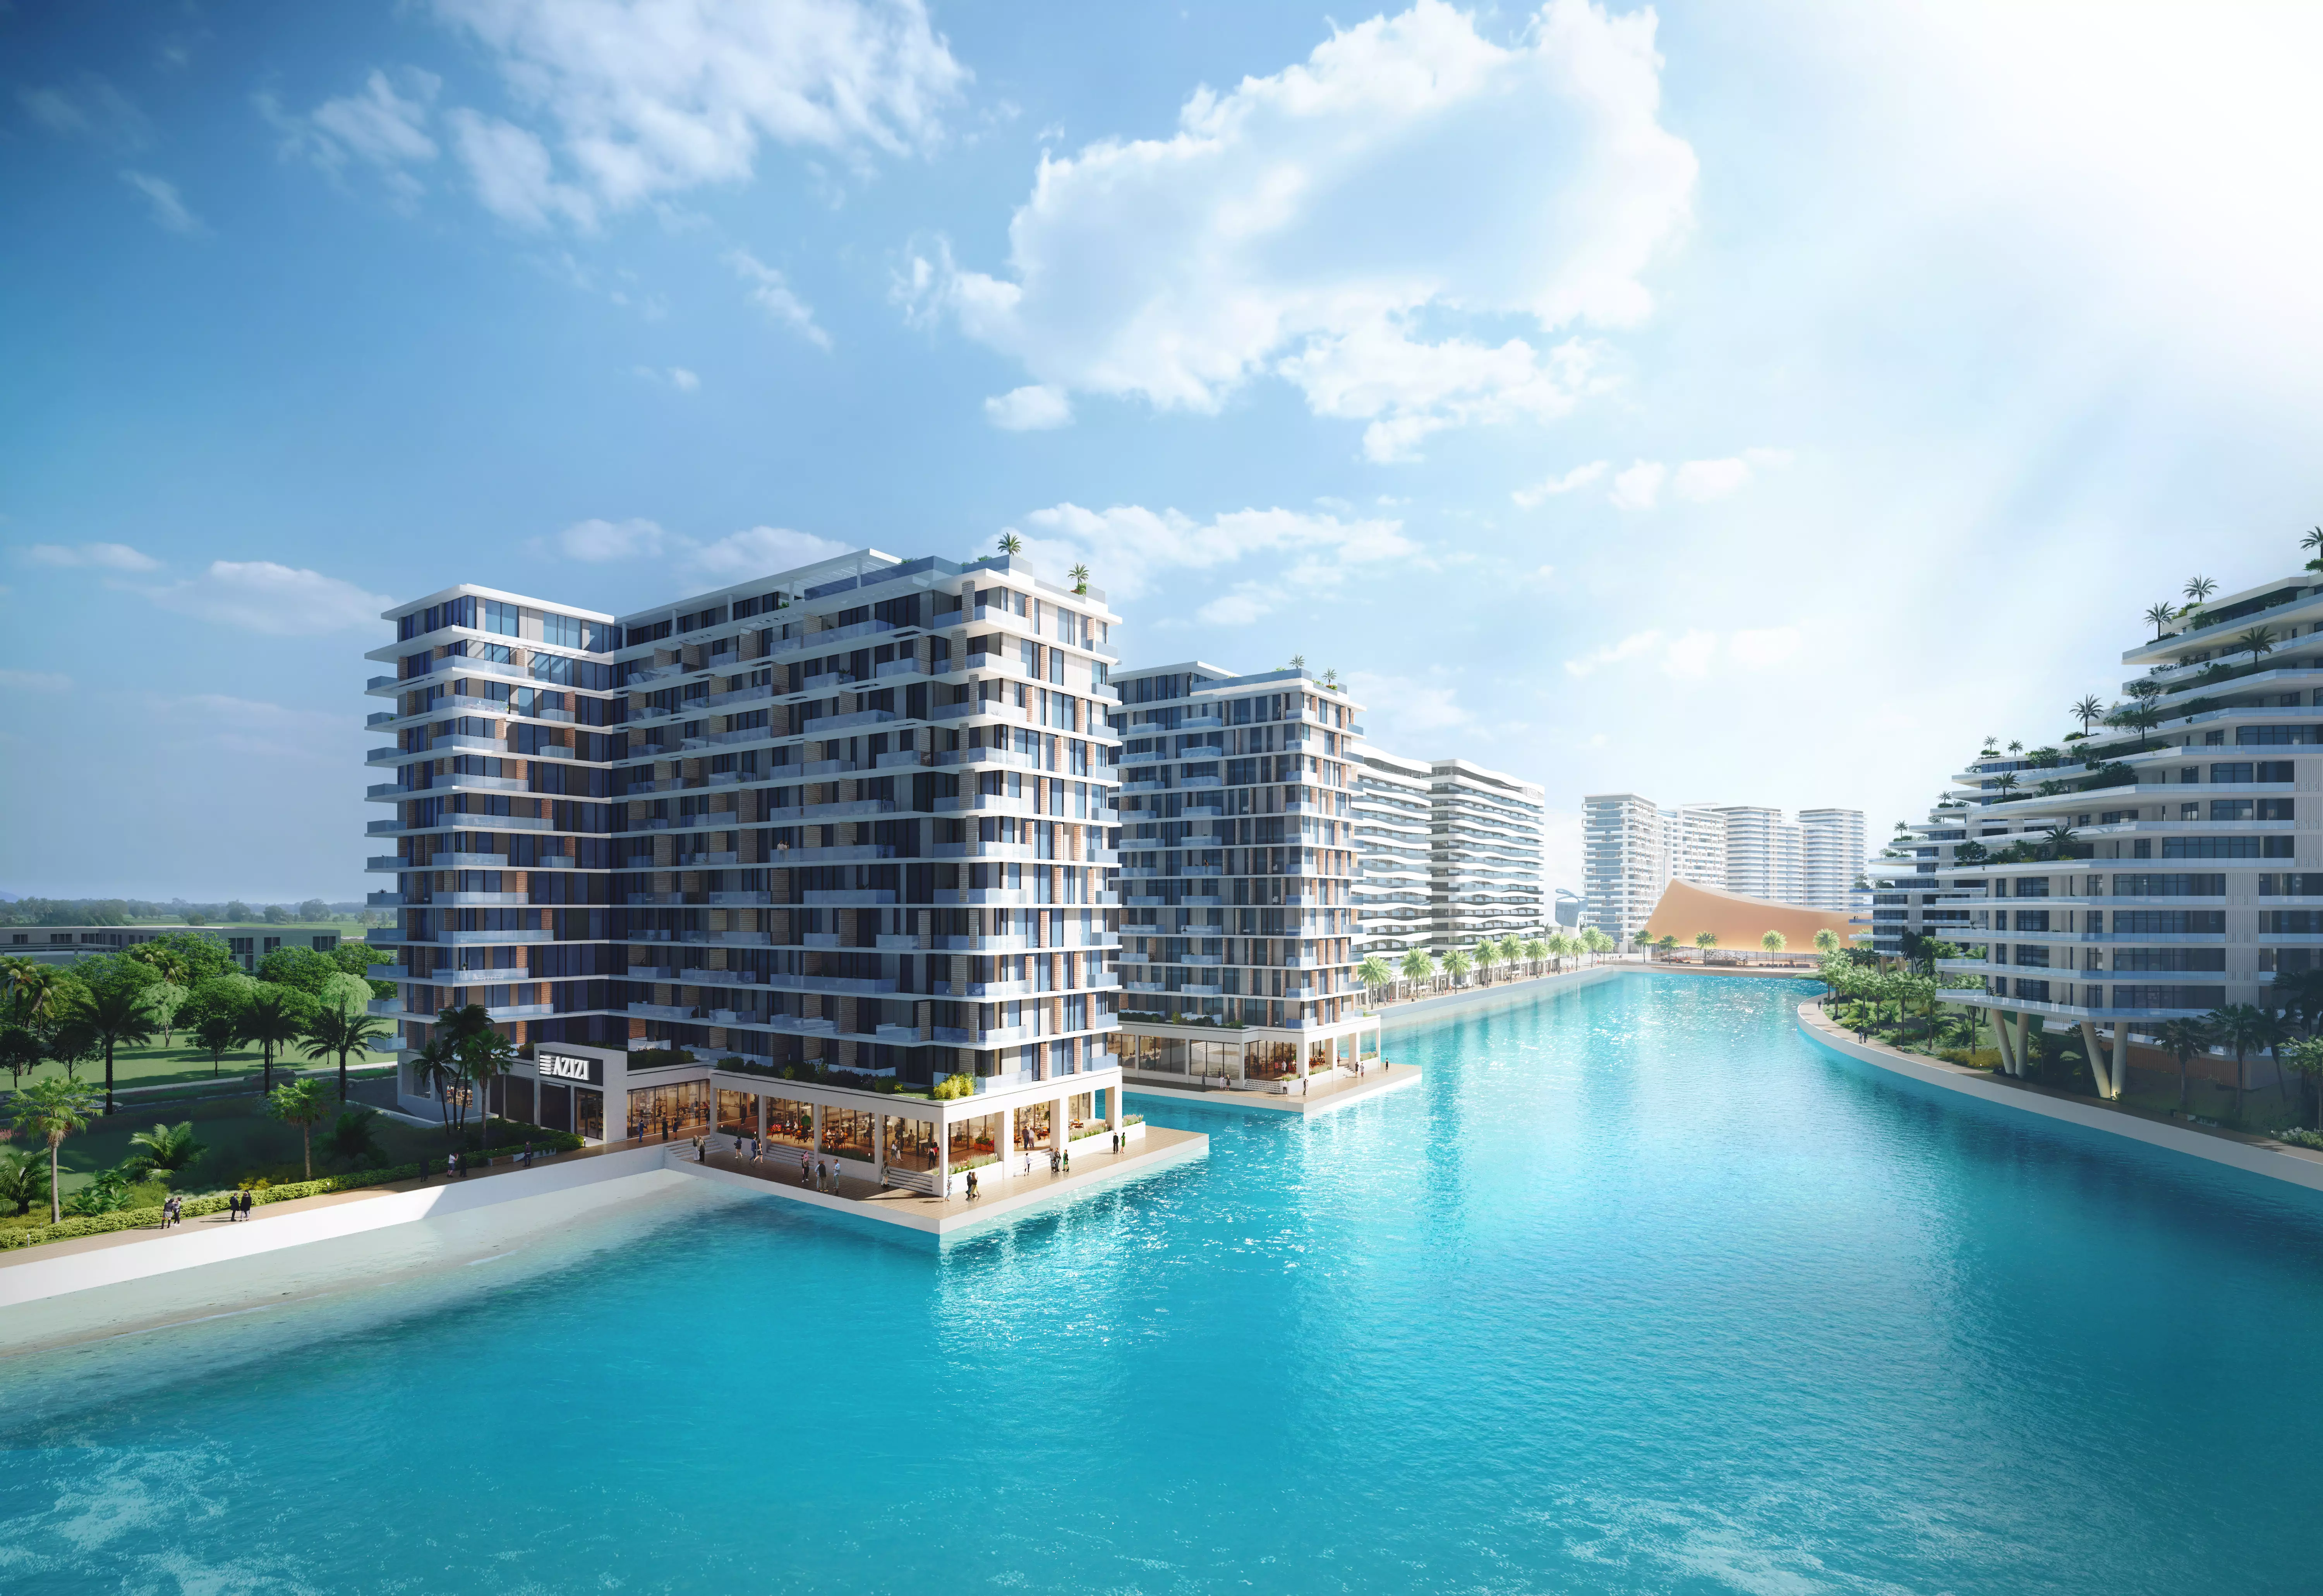
Azizi Venice, Dubai South — indicative listing, subject to developer confirmation. Early Bird Properties.
Where Dubai Buyers Actually Transacted in July 2026
The five most active areas by sales volume in July 2026 were Dubai South, Al Barsha South Fourth, Jebel Ali, Wadi Al Safa 4, and Jabal Ali First. Dubai South took the top position, which it also held across the second quarter — the only area to lead in both periods. That consistency matters more than a single month's ranking, because it points to sustained delivery and sustained demand rather than one large project registering all at once.
What these five areas share is instructive. None of them is a legacy prime district. They sit along Dubai's southern and western growth corridor, near the Al Maktoum International Airport expansion and the Expo City catchment, and they are dominated by off-plan stock at accessible entry prices. The centre of gravity in Dubai's transaction market has moved outward, and July's data is another month of that same pattern rather than a new development.
Where July's Dubai Transactions Sat on Price
July 2026 sales volume broke down by price band as follows: 43% of transactions below AED 1 million, 30% between AED 1-2 million, 11% between AED 2-3 million, 8% between AED 3-5 million, and 7% above AED 5 million. (These five price-band shares are as published and sum to 99% through source rounding.)
| Price band | Share of July 2026 sales volume |
|---|---|
| Under AED 1M | 43% |
| AED 1M – 2M | 30% |
| AED 2M – 3M | 11% |
| AED 3M – 5M | 8% |
| Above AED 5M | 7% |
The shape here is worth stating plainly, because Dubai's international reputation suggests something different. Seventy-three per cent of all July transactions were under AED 2 million, and only 7% were above AED 5 million. Dubai's transaction market by volume is an affordable-and-mid-market market. The luxury segment is real, highly visible, and carries a large share of headlines and of total value — but it is a small minority of the deals actually being registered.
That distinction matters because volume share and value share are different things, and Dubai coverage routinely blurs them. A single AED 100 million penthouse contributes as much to monthly value as roughly 140 sales at AED 700,000, while counting once in the volume figures. Both facts can be true at the same time: the top end drives a disproportionate share of the money, and the under-AED-2-million band drives the overwhelming majority of the transactions. The figures above are volume shares — how many properties sold, not how much they were worth.
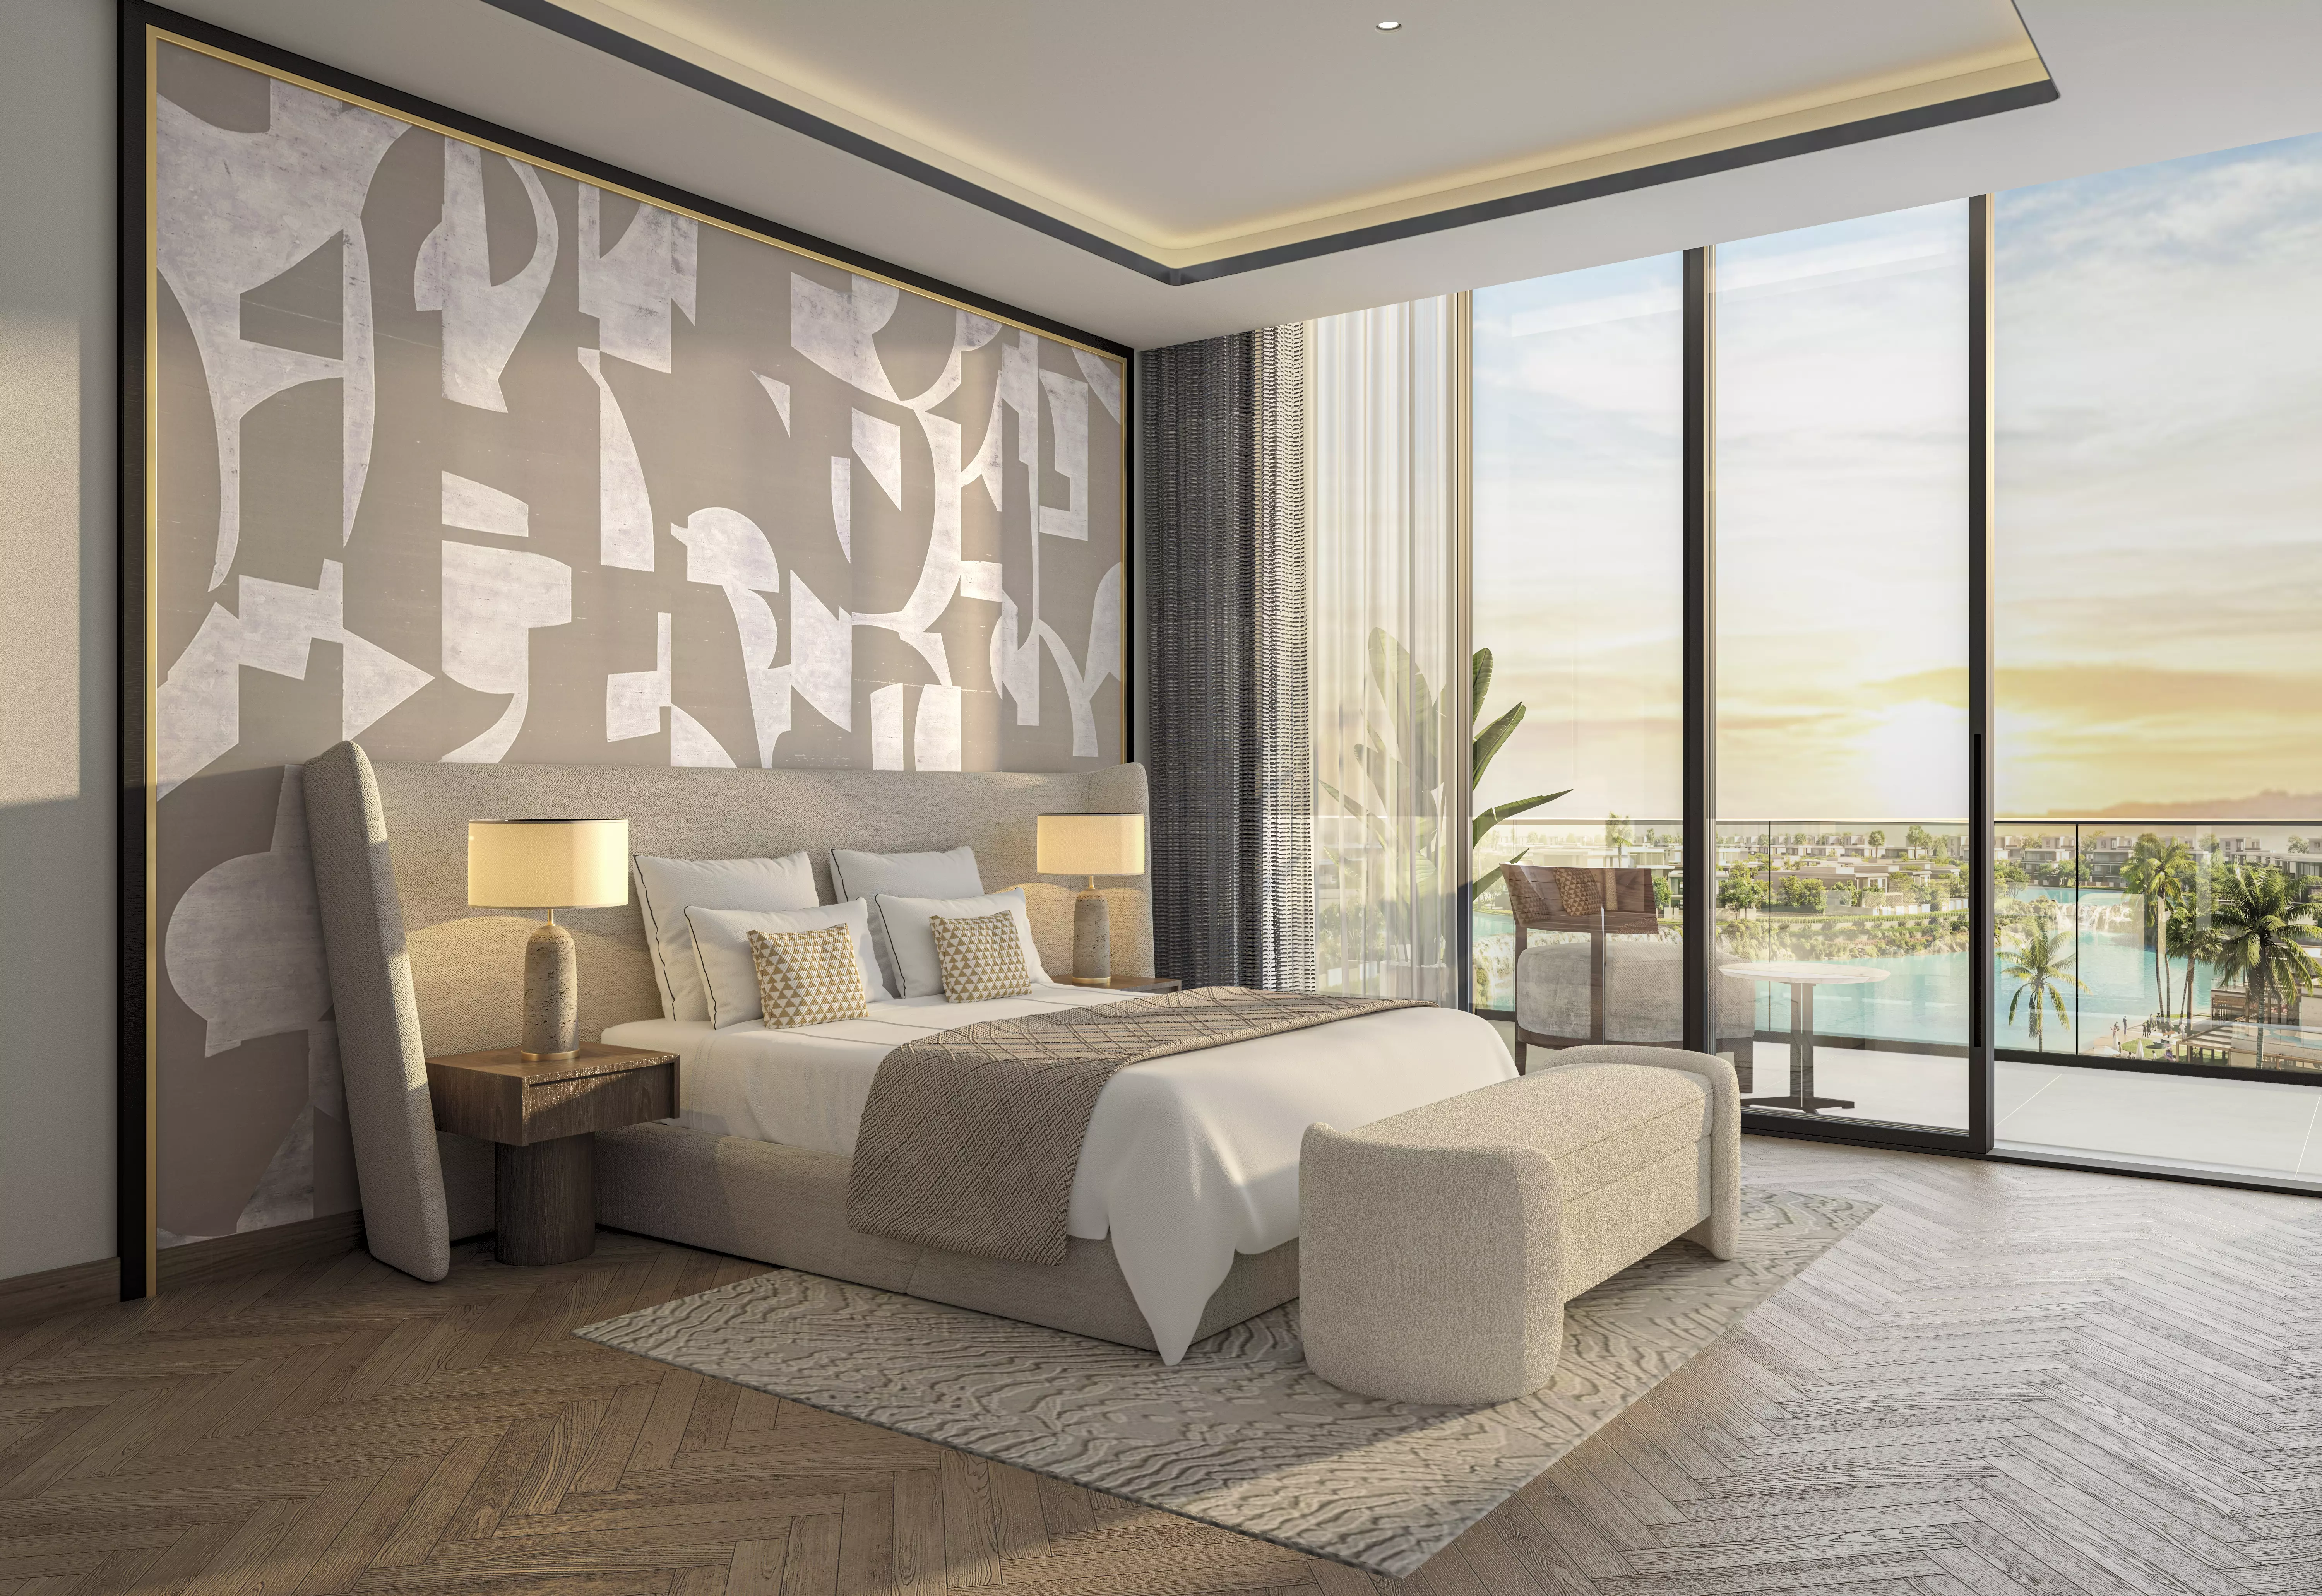
Entry-segment stock in Dubai South — indicative listing, subject to developer confirmation.
Want to know what these numbers look like for the area or budget you are considering? Message us on WhatsApp and we will send you the transaction picture for it — free, no pitch.
How July 2026 Fits the Wider Dubai Market Picture
July's figures are consistent with the quarterly data rather than a departure from it. April, May and June's sales volumes sum to approximately 38,000, matching the 38,257 sales recorded across the second quarter. First-half 2026 totalled 86,005 sales worth AED 286.43 billion. July's 13,872 sits in line with the recent monthly run rate, which is a useful check — when a monthly figure diverges sharply from its own quarter, the usual cause is a reporting artefact rather than a real market move. No such divergence here.
Our Dubai Q2 2026 market report covers the same quarter using the wider total transactions measure — AED 169 billion across 51,170 deals, including the mortgage registrations and gift transfers excluded here — so its headline figures are deliberately larger than the sales-only numbers above rather than in conflict with them. The same applies to our comparison of DLD transactions in Q1 versus Q2 2026. The continuing dominance of off-plan stock in the areas listed above is covered in off-plan versus resale in Dubai. Our full report library sits on the Early Bird market insights hub.
What This Means If You Are Buying in Dubai Right Now
A market running at 13,872 monthly sales rather than 19,000 is a different negotiating environment, and the practical differences are worth naming. Fewer competing buyers per unit means less pressure to commit on the day of viewing. Developers carrying unsold stock through slower months generally have more reason to discuss payment structure than they do when units are clearing quickly. Time to conduct proper due diligence — checking the escrow account, the completion record, the handover terms — is time you are far more likely to be given now than you were twelve months ago.
The price distribution also tells you where competition concentrates. With 73% of July's transactions under AED 2 million, the entry and lower-mid segments are where you will meet the most other buyers — and in July that meant the southern growth corridor above all. Above AED 3 million, at a combined 15% of volume, there are simply fewer transactions happening and correspondingly fewer competing bidders. That does not automatically make the upper bands a better buy; it depends entirely on what you want the property to do, and thinner segments can also be harder to exit.
One caution on reading monthly data at all: a single month is a short window, and Dubai's registration timing can shift transactions between months. July's numbers are best used as confirmation of a trend already visible across the quarter, which is how they read here. They are not a basis for timing a purchase to the week.
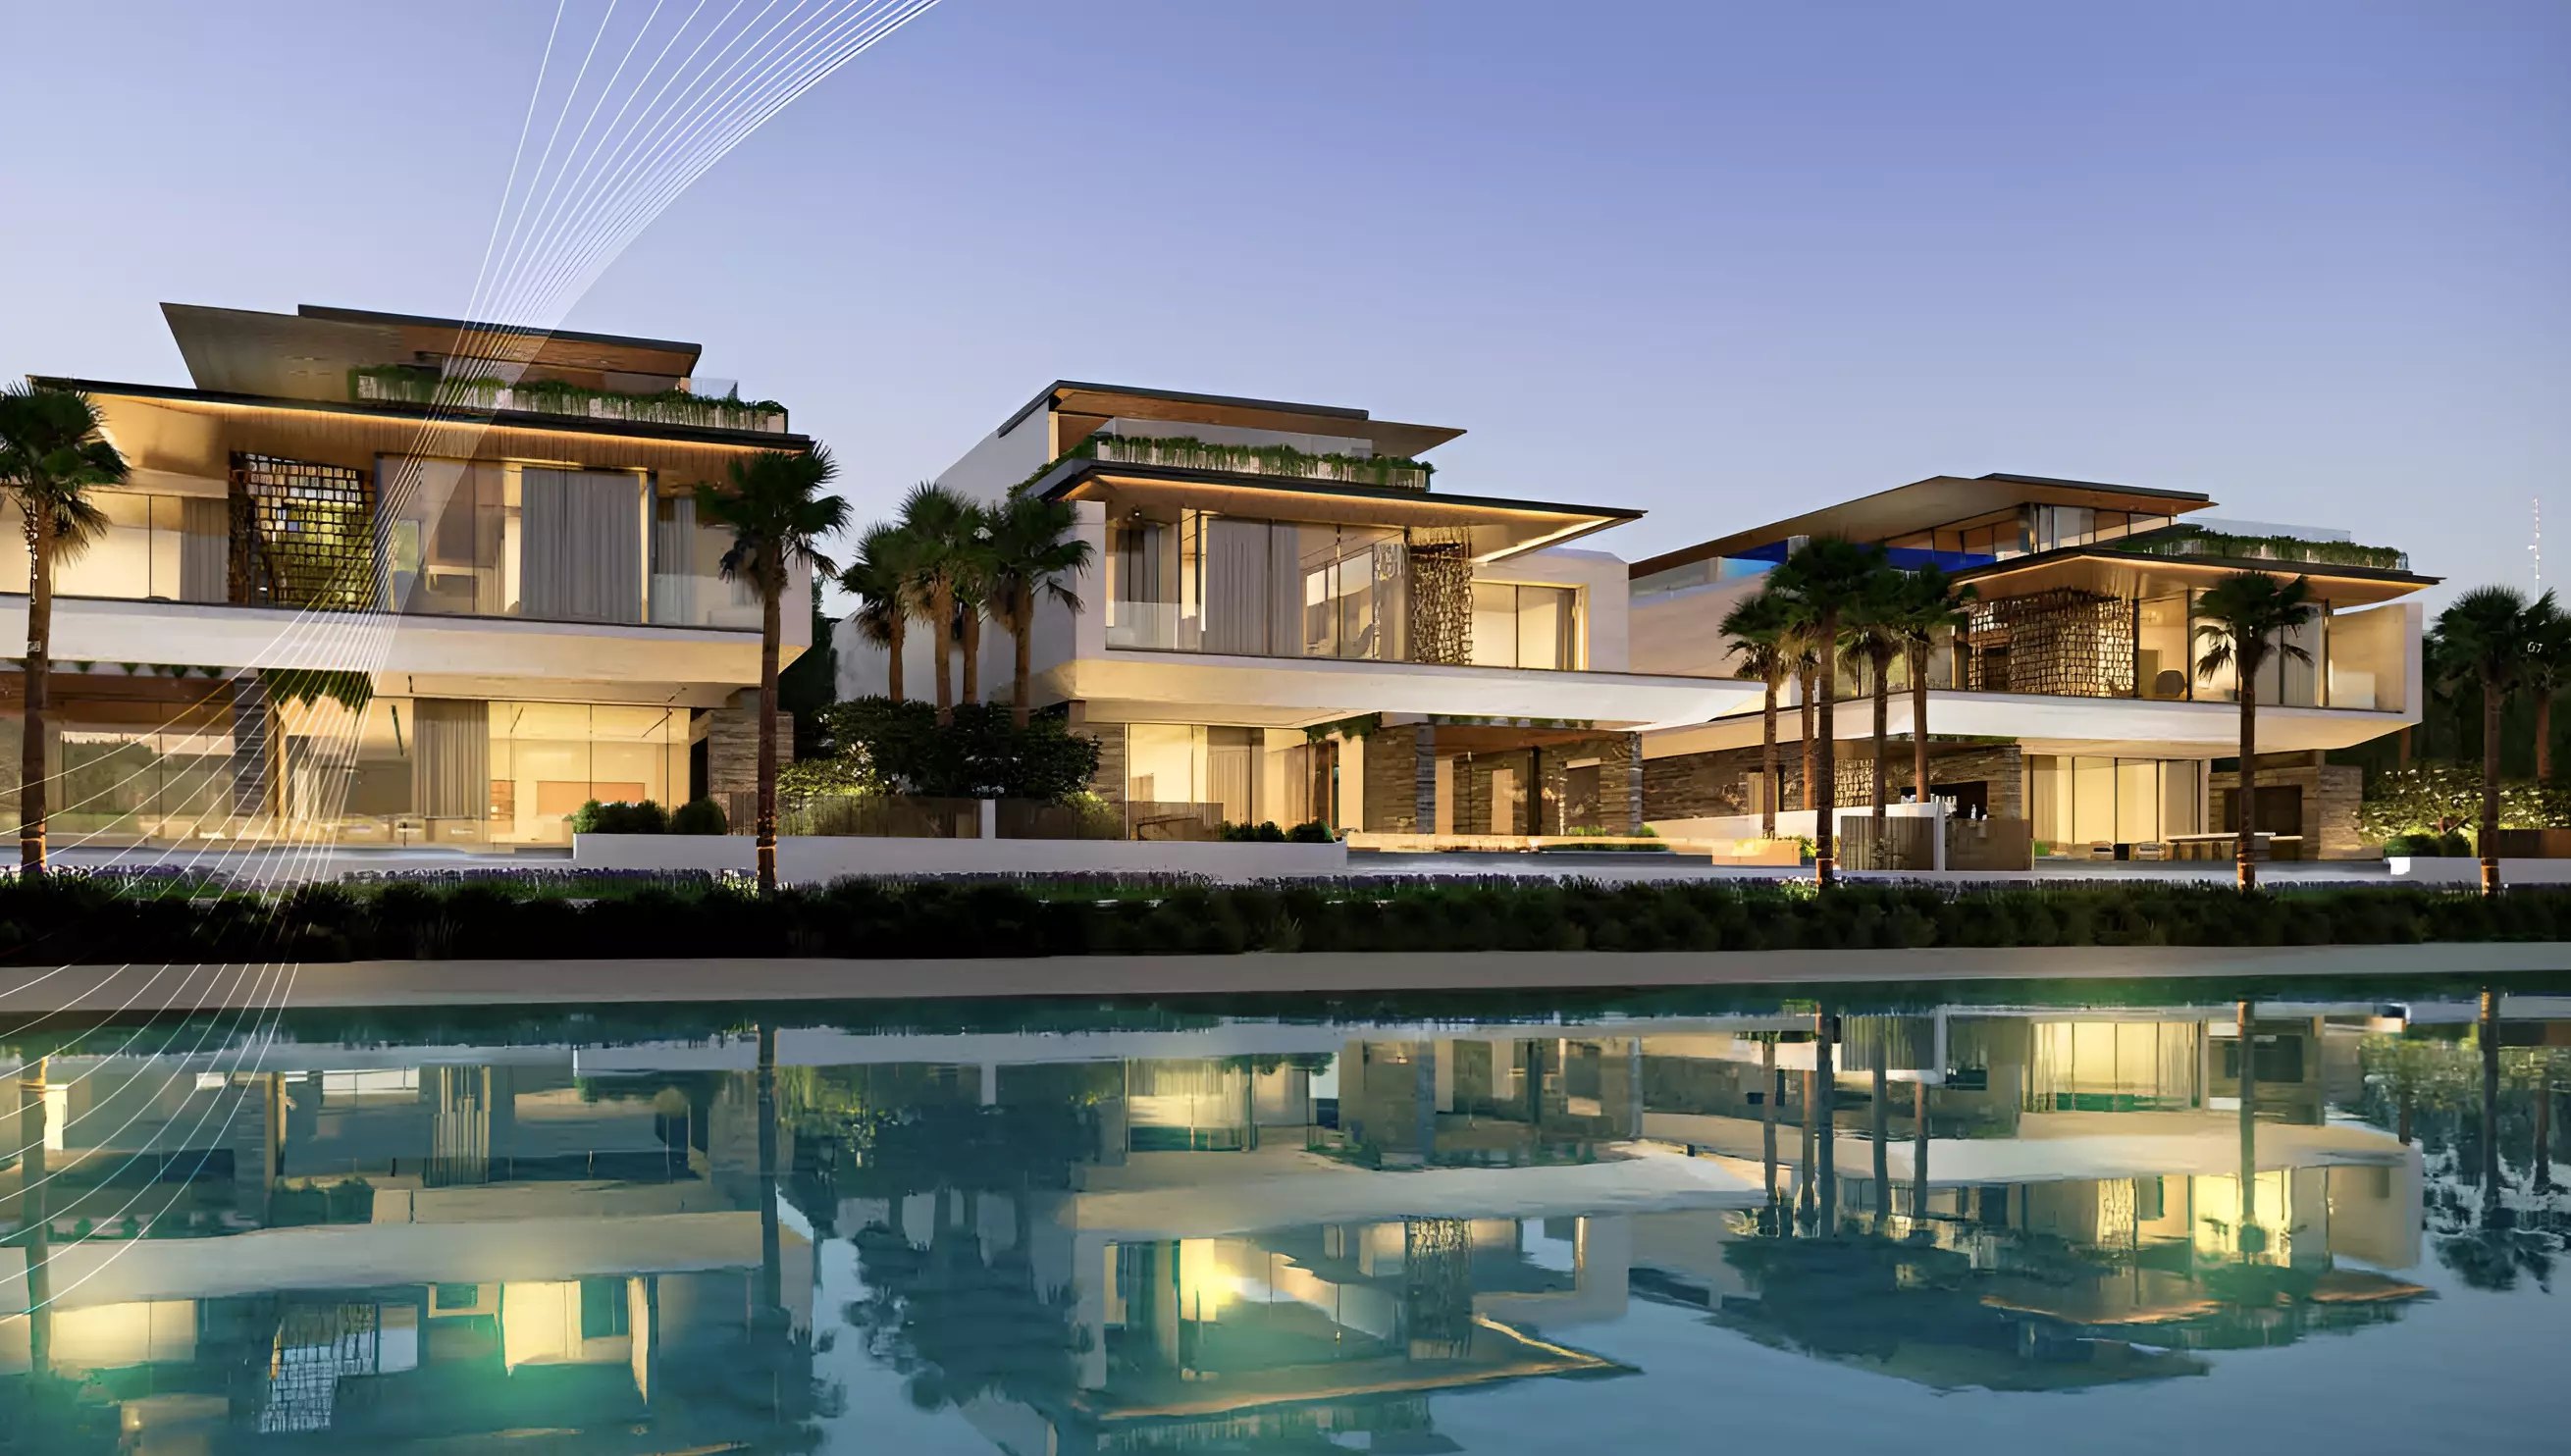
Dubai South — the emirate's most active sales area in both Q2 and July 2026.
Dubai Property Market July 2026: Questions Buyers Are Asking
Is the Dubai property market crashing in 2026?
No, though activity has clearly slowed. July 2026 recorded 13,872 sales worth AED 34.5 billion, with value up 3.9% on June. Year-on-year, volume fell 31.6% against a mid-2025 run of 19,000-20,000 monthly sales, and the average transaction also fell roughly 22% as villa sales contracted 56.4%. Slower and cheaper, measured against an unusually strong base.
How many properties were sold in Dubai in July 2026?
Dubai recorded 13,872 property sales in July 2026, worth AED 34.5 billion in total. This counts direct sale transactions registered with the Dubai Land Department plus DIFC registrations. It excludes mortgage registrations and gift transfers, which are reported separately and would produce a substantially higher combined figure.
Which area in Dubai had the most property sales in July 2026?
Dubai South led all areas by sales volume in July 2026, followed by Al Barsha South Fourth, Jebel Ali, Wadi Al Safa 4, and Jabal Ali First. Dubai South also led across the second quarter, making it the only area to top both periods — a signal of sustained delivery rather than one-off project registrations.
Why did Dubai transaction value rise while volume stayed flat?
Because the average transaction was larger. Volume changed -0.4% from June while value rose 3.9%, so a similar number of properties sold for more in total. Pinning that to specific segments would require June's price-band breakdown, which is not published alongside the July figures.
How much do most properties in Dubai actually cost?
Most Dubai property sales are well below the prices its luxury reputation suggests. In July 2026, 43% of transactions were under AED 1 million and 73% were under AED 2 million. Only 7% exceeded AED 5 million. Those are shares of transaction volume, not of total market value.
Is now a good time to buy property in Dubai?
Slower months generally give buyers more negotiating room and more time for due diligence than peak periods do. Whether that suits you depends on your budget band, timeline, and purpose — the under-AED-2-million segment remains the most competitive at 73% of volume. This is market context, not personal financial advice.
Methodology and Sources
Transaction figures in this article are sourced from DXB Interact's July 2026 monthly market report, which compiles Dubai Land Department and DIFC registration data. All figures measure sales transactions only and exclude mortgage registrations and gift transfers. Quarterly sales-only figures (38,257 second-quarter sales, AED 110.4 billion) come from DXB Interact's Q2 2026 report; half-year totals and the wider total-transactions measure are drawn from Dubai Land Department half-year figures as published in Early Bird Properties' Q2 2026 market report. Percentage shares are reproduced as published and sum to 99% through source rounding. Property examples are indicative listings, subject to developer confirmation, and are shown as market illustration rather than as an offer or solicitation.
This article is market commentary and general information, not financial, investment, or legal advice. Property values can fall as well as rise. No developer marketing fees; recommendations based solely on investor interest alignment.

Muhammad Zohaib Saleem — Founder, Early Bird Properties (RERA / DLD ORN 37167). In Dubai real estate since 2013.
Zohaib publishes Early Bird's monthly market pulse from primary Dubai Land Department and DIFC registration data, with the metric definitions stated in full so readers can check the figures against the source themselves.
Looking at a specific area or price band and want the transaction picture behind it? Early Bird Properties works from the registration data directly — including the off-plan stock in Dubai South that led July's volume, such as Azizi Venice. Tell us the budget and area you are weighing up and we will walk you through what actually sold there, at what price, and what is still available.
Ask us about your area on WhatsApp
Prefer to read first? Our full library of Dubai market reports is on the market insights hub.